
Team Liquid v Cloud9 (LCS 2021-04-03)


Team Liquid are facing off against Cloud9 in round 2 of the LCS Mid-Season Showdown next Saturday, and if you follow us on Twitter or Facebook you’ll have seen what can politely only be described as a rather bold bet.
The two teams seem to be fairly evenly matched, slightly tilted towards Cloud9, but we actually believe Team Liquid are pretty heavily favored, and are suggesting betting accordingly:
| metric | Team Liquid | Cloud9 |
|----------------------------|-------------|------------|
| Market Odds | 2.08 (+108) | 1.7 (-143) |
| Implied Win Probability | 48.08% | 58.82% |
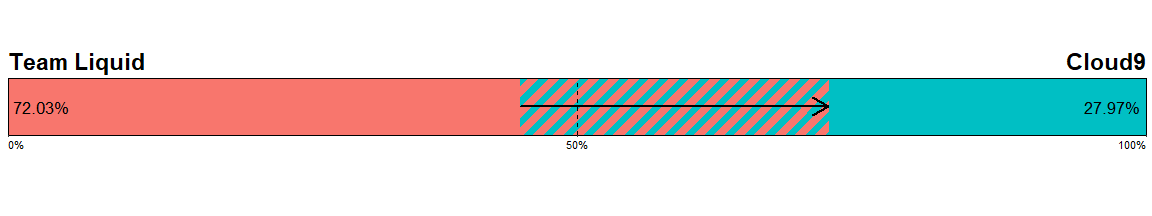
| Calculated Win Probability | 72.03% | 27.97% |
| Expected Value | 0.3943 | -0.6096 |
| Bet Size | $365.11 | $0 |In this article, we’re going to go over some of the considerations our model makes in its predictions, the relative importance of each of these considerations to our overall bet, and some color on the nature of quantitative modeling.
This article is going to be a bit more math/stats-heavy than normal, so consider yourself warned! If you want to skip the math, the TL;DR is:
If you build a quantitative model and it gives a strange prediction, it’s almost always better to trust and follow it than try to manually override it based on what feels more correct.
The Market
As of our initial bet placement, market odds were Cloud9 1.7 (-143) vs. Team Liquid 2.08 (+108). We can use these odds to get the market-implied percentage probability of each team winning the match: 48.08% Team Liquid vs. 58.82% Cloud9. This doesn’t add up to 100%, which seems problematic; this is due to the vig, which we’ve alluded to several times and will be exploring the effects of in a future article. For now, we can simply say that these probabilities are the hurdle we have to overcome on either side for it to be worth placing a bet, and we can normalize them to get the market’s true sentiment on the match’s outcome: 44.98% Team Liquid vs. 55.02% Cloud9.
In short, Cloud9 is slightly favored, but it should be a pretty even and competitive match.
The Model
Our model, trained on over 28,000 professional games worth of data, has a different view:
This is one of the largest divergences between our model and the market that we’ve seen yet (there are a few instances in some other leagues, but more-watched and more-bet-on leagues such as LCS and LEC tend to have tighter markets).
While going into the nitty-gritty details of the model itself is difficult, we can try to isolate some of the things it looks at and distill them down to something we can intuitively understand.
The Players
On paper, Cloud9 seems like the better team - they have a slightly better seasonal record (13-5 to Team Liquid’s 12-6), and individually, their players look stronger. Here’s the pro-game winrate for each player in the game, adjusted to weight more recent games more heavily:
| player_name | winrate |   team_name |
|-------------|---------|-------------|
|       Fudge |  66.36% |      Cloud9 |
|    Tactical |  65.12% | Team Liquid |
|      Blaber |  64.48% |      Cloud9 |
|       Perkz |  63.77% |      Cloud9 |
|        Zven |  63.39% |      Cloud9 |
|      Vulcan |  62.61% |      Cloud9 |
|      Jensen |  61.95% | Team Liquid |
|      CoreJJ |  61.82% | Team Liquid |
|    Santorin |  59.50% | Team Liquid |
|     Alphari |  58.40% | Team Liquid |
Both teams are full of players with impressively high winrates - these players are consistently at the top of the competition. Sorted by winrate, however, we can see that with the exception of Tactical, the entire Cloud9 roster ranks above Team Liquid. The average differential is 2.76%, which we might naively believe to be Cloud9’s edge in this game, at a minimum.
Beyond simple winrate, we can try to make adjustments for currently viable champions. Each patch shakes up the meta, which can greatly benefit players whose comfort champions are particularly strong at the moment. We’ve isolated what we believe to be the most dominant champions in the current patch, and have plotted the relative proficiency of each player with those champions:
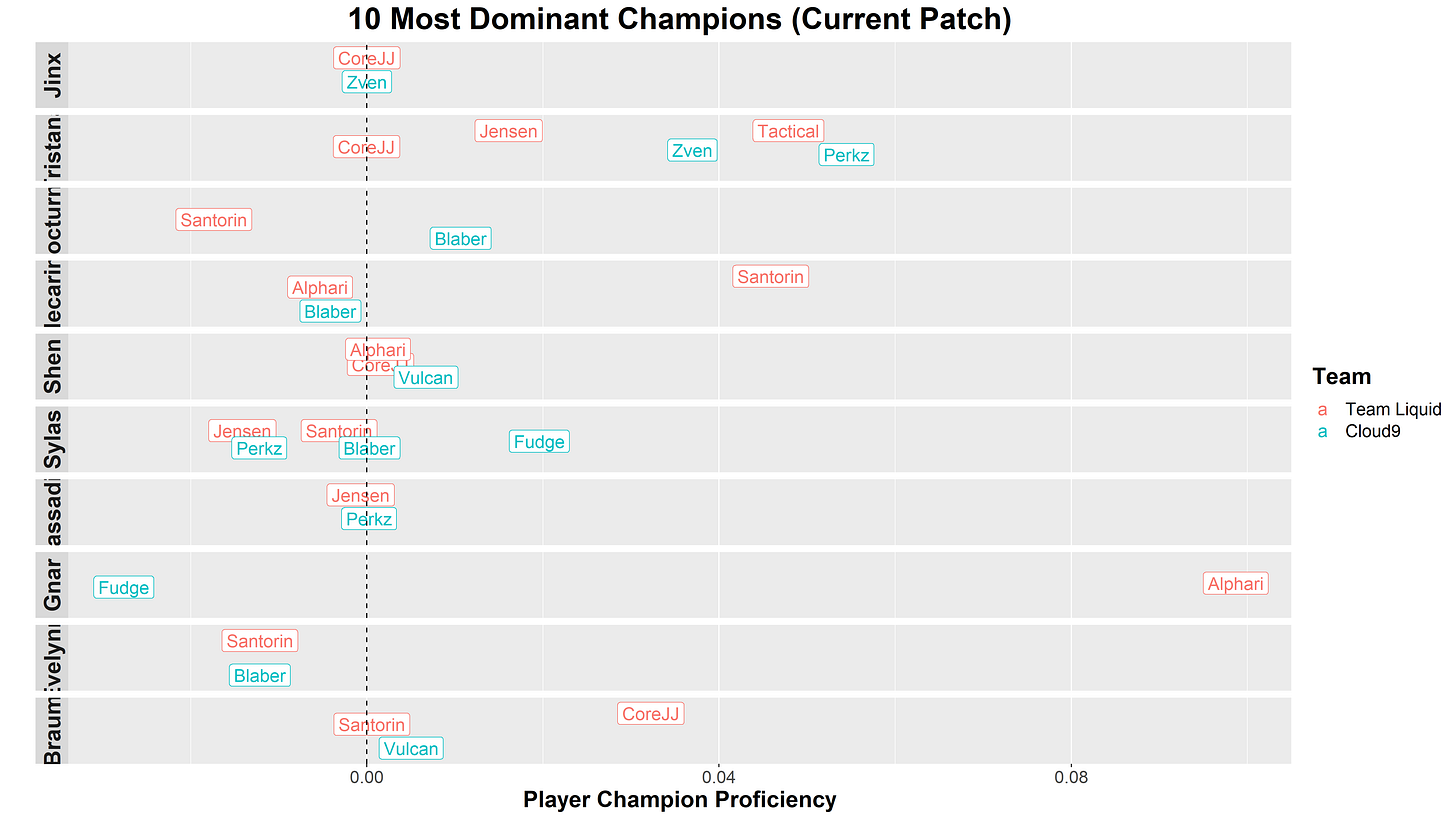
The exact numbers aren’t really worth worrying about, but here are some quick takeaways:
- Jinx, the most dominant champion at the moment, isn’t one that either team plays masterfully. CoreJJ and Zven are both right on par with them.
- Tristana is the big point of contention - both teams have players that are quite good with them, so advantage doesn’t really swing to either team but this will be an interesting one to look out for in the drafts.
- Hecarim and Gnar are the only other champions with outsized proficiency among any of our two teams’ players, and both can be quite dangerous in the hands of Team Liquid.
Overall, this patch doesn’t massively favor either team in terms of meta champions, but there seems to be a slight tilt in Team Liquid’s favor.
The Teams
So far, we’ve discussed how good the individual players on each team are, and whether the current patch favors any of them. This overlooks a pretty important aspect of the game, however: this is a team game!
Some teams simply click better, and can turn into something greater than the sum of its parts. Perhaps their playstyles mesh better, or they have more trust in each other, or more effective shotcalling. Whatever the reason, a team that runs seamlessly will generally outperform a random collection of great players.
Here, we look at the relative edge of every pairing of players on each team. For example, we see that Blaber paired with Zven has a 4.66% edge. This means that Blaber’s winrate while playing with Zven is 4.66% higher than their winrate playing without Zven! Part of this, of course, could be due to Cloud9’s general dominance, but if a collection of strong players playing together are all performing even better than they had been before, clearly the team setting is amplifying their strengths.
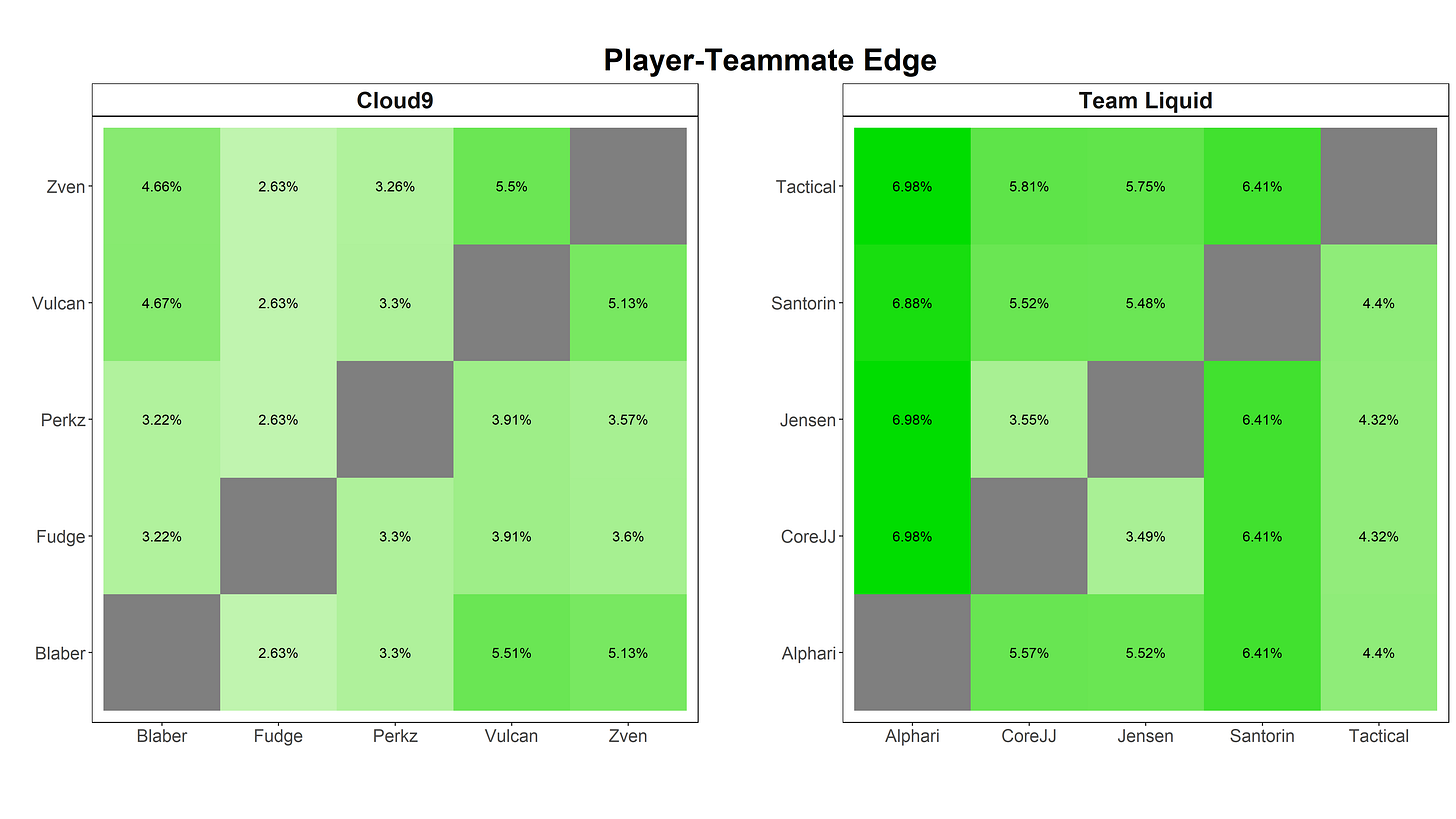
Players on both teams, across the board, do better with all of their current teammates than they did without them. Both teams, then, have taken great players and really pushed their strengths further. However, Team Liquid clearly has an advantage here; while their players individually may not be as good (per our winrate table earlier), they play better together: the average edge of Team Liquid’s teammate pairings is 1.79% higher than that of Cloud9. Small advantages can snowball pretty quickly in these games, so even a slight increase in coordination can have pretty massive effects on the outcome.
On top of looking at how well teams do relative to their players’ individual strengths, we can also take a look at how well teams do against each other. This isn’t the first time Cloud9 and Team Liquid have clashed; Cloud9 lost both times it played against Team Liquid this season (weeks 3 and 5), and lost 2-3 in the Lock-In finals. That doesn’t necessarily mean that they’re bound to lose, as anything can happen in each individual game, but it does lead us to this thought: what if Cloud9 is just systematically weak to Team Liquid, due to playstyle differences, matchup differences, or something else?
Unfortunately, we can’t really just look at specifically Cloud9 vs. Team Liquid games; there aren’t enough games played with these exact rosters to get meaningful data for our model, and as rosters change these results could get pretty thrown off. Instead, we’ll do something similar to our teammate analysis; for each player, we’ll look at their edge against each player on the opposing team, across all games they have played against that player (not necessarily representing C9 or TL). We define edge as their winrate against that player relative to their winrate when not facing that player:
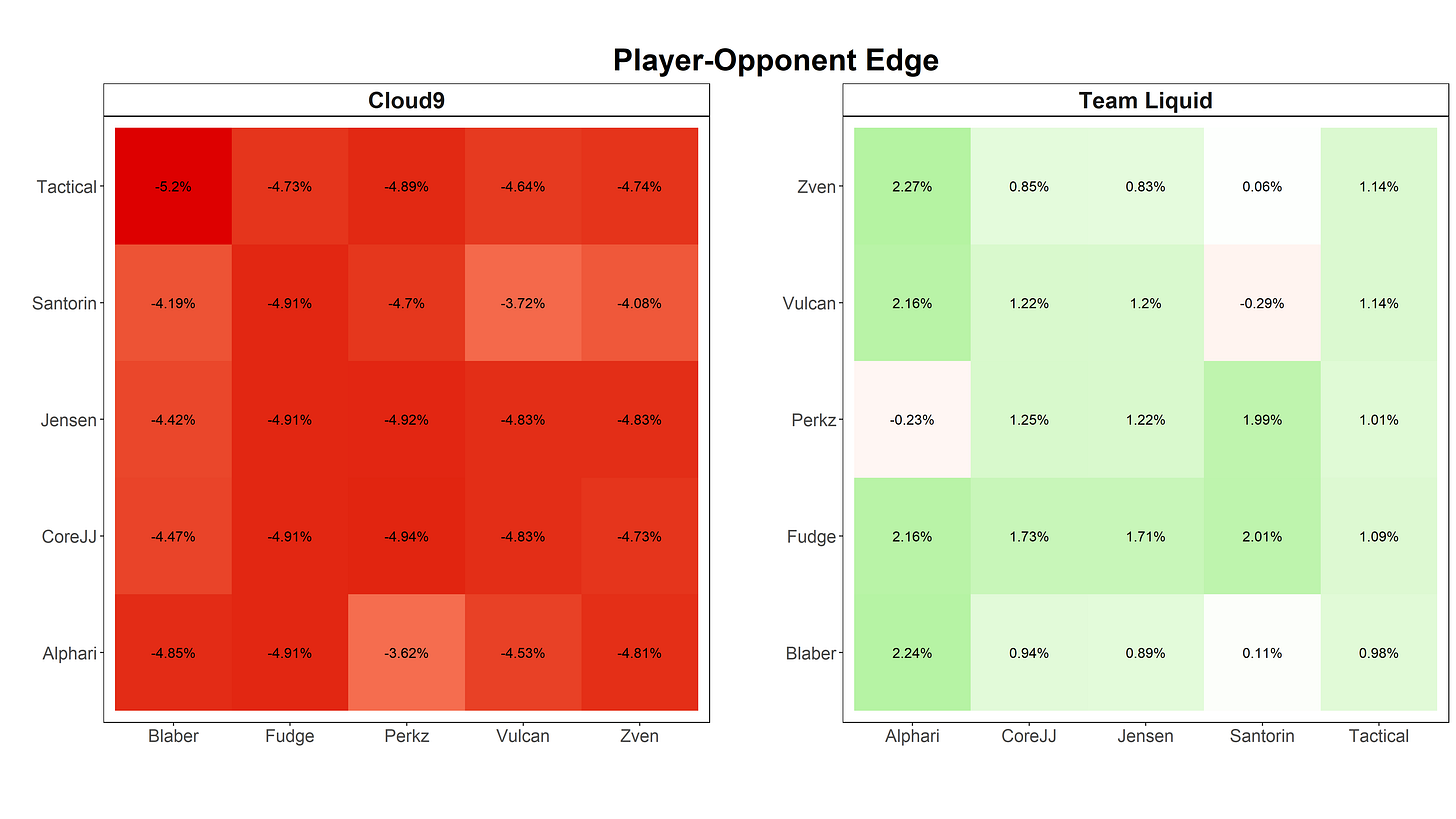
That’s a lot of red! Every single player on Cloud9 does worse than their norm when facing any of Team Liquid’s squad, while Team Liquid almost always does better. In fact, there’s a 5.84% differential between the average edges of these two teams - so, based purely on the matchup of these two squads, we could say that Team Liquid should win 5.84% more often than we would otherwise think.
Statistical Modeling Nuances (and nuisances)
At this point, we’ve thrown a bunch of numbers around, and it’s worth taking a step back and talking about what they mean, how to use them, and some pitfalls of relying on pure quantitative models.
First off, the percentage edges we’ve given above do not necessarily reflect the actual probabilities of each team winning. That doesn’t make them useless - they certainly give us a sense of the magnitude of difference in these various metrics, we just can’t directly add them up together. Without going into too much detail on the model, what it effectively does is it takes these numbers (and some other factors not discussed here), calibrates the proper weight of each factor (i.e. how important each piece of information should be), and then uses that to derive a final probability.
If this seems a bit dangerous (after all, is there an intuitive reason why factor A should be more important than factor B?), well, that’s just the nature of statistical modeling. Sometimes, statistical models make seemingly strange predictions, and you’re going to want to overrule them because you can come up with a logical justification of why the output doesn’t make sense. Do not do this! This is actually just a form of confirmation bias - you know what you expected, and when the model disagrees, you can always find some seemingly reasonable explanation for why the model is wrong. The thing is, though, if things were flipped you’d be able to find a justification in the other direction as well.
This isn’t to say that the model is actually correct, however. This is a sort of counterintuitive point, and one of those weird nuances of the field: in any given instance where you disagree with the model, you might actually be right, and even for the right reasons! These models are built on large sets of data, designed to make good predictions on average, and so any match might have some strange fluke where the data doesn’t apply in the same way. For example: maybe our model says that generally, your edge against your opponents is significantly more important of a factor than individual players’ strengths. However, in some specific matchup, maybe team A has a history of beating team B, but team B has completely revamped their training style, while team A has been slacking on fundamentals, etc., etc. You might, therefore, say that we should disregard the model, because it’s focusing on the wrong things. Because the model was built to try to make good predictions when applied to all games, it’s not ideal for any one situation, so again, you might just be right! Here’s the caveat, though: your ability to discern which matches the model is making this sort of mistake on is significantly worse than you think it is. It’s easy to think that you’re taking the quantitative base of the model as a starting point and just adding your “expertise” on top of it, but it’s really easy to fall into a confirmation bias trap.
Take it from someone with seven years of experience building models in quantitative finance: overruling models almost always ends up worse. Not because our intuitions are wrong, but because people are notoriously bad judges of when our intuitions are right (in short: we pretty much always think we’re right). Give it enough time, and a model should always revert back to its average (assuming, of course, you haven’t overfit the model, which is a discussion for another time).
Sometimes the model makes a weird choice, and that’s just honestly how it is. It’s not even necessarily possible to say that the model made a bad prediction - if the bet goes against us, does that mean the model was wrong, or maybe we just hit that 28% chance that C9 wins even according to our model?
We want to point out, however, that you shouldn’t completely ignore that feeling of the model being wrong. This is actually a great catalyst to pull the model apart, figure out why it’s making the decision that it’s making, and potentially adjust the model or find new factors for it to incorporate. This is part of the iterative process of model-building. However, you should never make on-the-fly adjustments for qualitative reasons.
In short: any individual game might not pan out, either because the model was wrong, or simply because nothing is a sure thing and that’s how probabilities work (and there’s rarely a good way to differentiate the two), so your best defense against this is to cast as wide of a net as possible. We’ve brought this up countless times before and we’ll keep bringing it up (including an article dedicated to the concept), because it’s worth repeating: the more bets you make, and the more games you bet on, the closer the model will perform to its expectations.
The Bet
We talked about betting based on EV in a prior article, but skipped over a pretty major corollary: to be an effective bettor, you should bet more money when there is more EV to be had. We’re planning a future article on betting theory that will explore this concept further and introduce some bet sizing strategies, but for now, the takeaway is that with such a massive difference between our own estimate and the market’s estimate, we should be putting our money where our mouth is.
In this case, we’re getting slightly better than even-money odds on a bet that we think should pay out more than twice as often as it loses!
|                     metric | Team Liquid |     Cloud9 |
|----------------------------|-------------|------------|
|                Market Odds | 2.08 (+108) | 1.7 (-143) |
|    Implied Win Probability |      48.08% |     58.82% |
| Calculated Win Probability |      72.03% |     27.97% |
|             Expected Value |      0.3943 |    -0.6096 |
|                   Bet Size |     $365.11 |         $0 |
And here’s the thing: this bet is worth making as long as we think Team Liquid has more than a 48.08% chance of winning! Even if our model missed the mark by a bit, any prediction it has above 48.08% for TL would have positive EV. Of course, in that situation we wouldn’t want to put so much money on the match, but at the very least we believe that we should be directionally correct pretty much no matter what here.
We might lose this bet, but we won’t even know if the model was truly wrong or if Cloud9 pulled out the 28% upset. 1 in 4 is hardly rare, after all.
And once again, to reiterate: we can play it safe and tone the bet down, but in the long run it’s safer to trust the model. After all, across all games so far (which, again, is necessary to give the model enough shots at the target to be statistically relevant), the model has done quite well for us!
For more in-depth match analysis, predictions, and quantitative betting strategy tips, subscribe to stay in the loop. You can also follow us on Twitter (@AlacrityBet) for quick prediction snapshots of upcoming matches. Alacrity is your fastest path from simply gambling to beating the market. Stay ahead of the game!