
Spring 2021 - Performance Recap


With the first split of the LCS and LEC seasons wrapping up, we thought it would be a good time to check in on our overall performance so far. If you follow us on twitter, you’ll have seen a quick summary of these statistics already, but we’re going to take a deeper look at the numbers, our expectations, and what we can learn from them. If you don’t follow us on twitter, check us out here to stay in the loop on predictions, weekly recaps, and more!
LCS
Let’s start with the worst: in the first split of LCS, our performance was far from what we had hoped:
|                      metric |       val |
|-----------------------------|-----------|
| Total PnL (on $1000 budget) |  $-665.17 |
|               Total Wagered | $1,937.13 |
|           Number of Matches |        91 |
|              Number of Bets |        27 |
Obviously, our expectation was to make money; each individual bet had positive expected value (or we wouldn’t have placed it), so the sum of all of our bets should have had positive expected as well. We’ll keep reiterating this point: this simply means that on average, you should expect to make money. Variance is a very strong force, especially when we’re only making 27 bets.
It’s worth noting that of the 91 matches that we tracked and had odds for, we felt like we had a worthwhile edge on 27 of them, or just shy of 30%. That means that 70% of the time, our predictions lined up with the market closely enough that we couldn’t beat the vig. We shouldn’t necessarily read too much into this - after all, we expect the oddsmakers to be reasonably good at what they do - but it may be worth remembering to see how it compares to other leagues.
Let’s take a look at the individual bets:
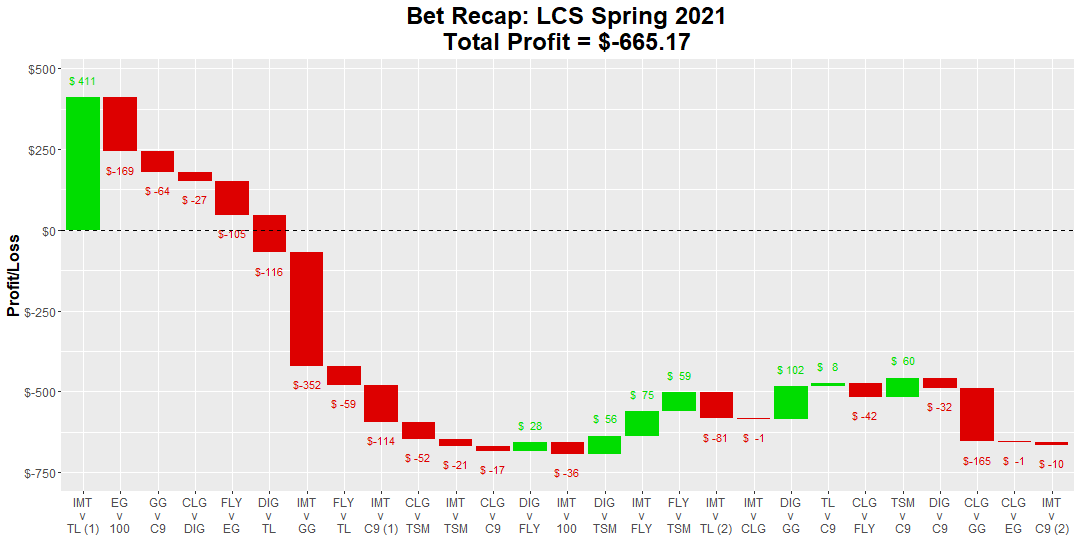
A couple of things stand out:
First, we had an extraordinary losing streak in the first half of the season. If we had simply always picked the favorite, or always picked the underdog, or flipped a coin, or just asked our neighbor’s dog for suggestions, we would have done better (note: we don’t actually advise doing any of these things). The mathematical term for this is really bad luck. We could go through and calculate the statistical likelihood of this streak, assuming either our predicted odds or the market’s implied odds for the outcome of each game, to show just how unlikely this is, but frankly it doesn’t really matter. Sometimes, you get unlucky, which is why placing more bets is always better. You get unlucky here, maybe you get lucky in some other league.
Second, betting on Golden Guardians has simply been disastrous. Of the 18 games they played, we placed bets on 4. The first was betting on GG (vs C9), which they were likely to lose but the payout made it worth the risk. The other 3 bets were against GG (we thought they were even more unfavored than the market did), and those bets happened to include 2 of the 3 games that GG won this season. Statistically, it’s still correct to place these bets whenever we think there’s positive EV, but psychologically it’s going to feel painful to trust the model (take it from experience in finance: making manual adjustments to a model because something feels bad or wrong almost never ends well).
How well did we expect to do, then? Well, we’ve got our placed bets, the odds we placed them at, and our predicted probability of winning each bet, so let’s just run a Monte Carlo simulation: we’ll randomly sample the outcome of each match according to our predicted probabilities to create a simulated run of what could have happened, then do that 10,000 times and see what would happen on average:
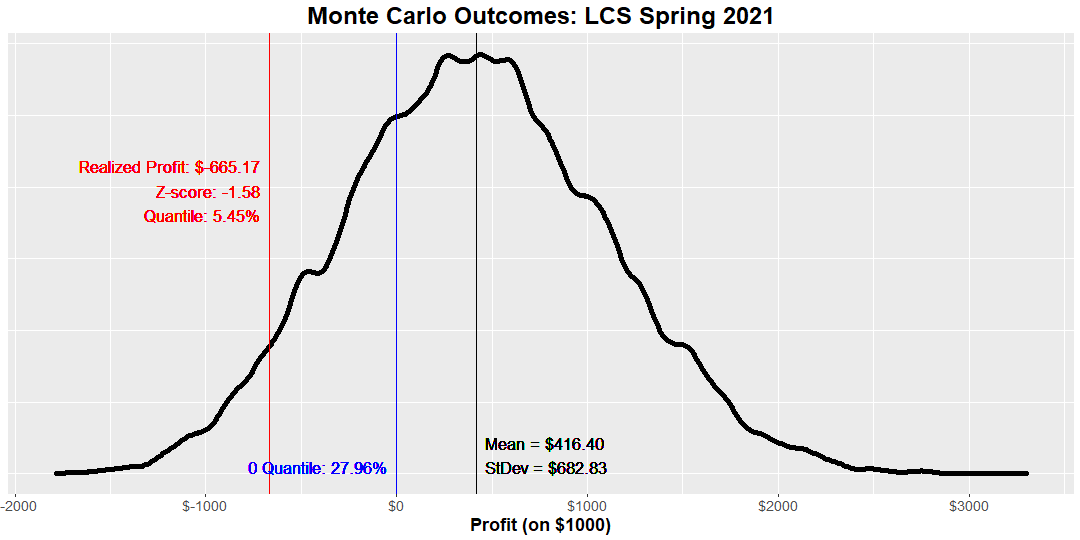
On average, we would have expected a return of $416.40, but naturally there’s quite some spread around that value. Our realized loss of $-665.17 falls in the 5.45%-ile, which means that across our simulations, there was a 5.45% chance of doing as poorly as we did or worse. That’s like rolling a 1 on a d20, and who here hasn’t had a critical fail in DnD at the worst time? In fact, there’s a ~28% chance of not even being profitable across the season. That risk is always present; we are technically gambling, after all.
In short: LCS didn’t pay out the way we expected, and we believe we got fairly unlucky, but not so unlucky that it’s out of the realm of possibility. If we could do it over again, we’d do the exact same thing, because that’s how statistics works.
LEC
LEC, on the other hand, was profitable, though not nearly enough to offset our LCS losses:
|                      metric |     val |
|-----------------------------|---------|
| Total PnL (on $1000 budget) | $102.85 |
|               Total Wagered | $940.91 |
|           Number of Matches |      45 |
|              Number of Bets |      14 |
With half as many matches played and half as many bets placed as LCS, our potential for gains was lower. Any gain is good, of course!
And the individual bets:
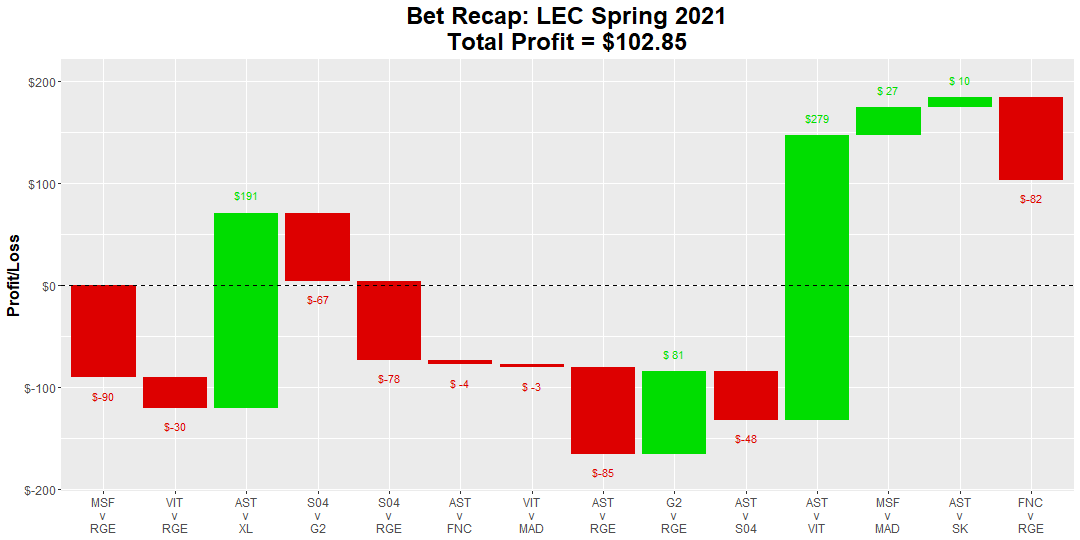
Some swings up and down, with most of the profit coming from a couple of big winners. This is the nature of the game: most often we’re betting on underdogs, who we still believe are unfavored, just not as much as the market does. As a result, we still expect to lose more bets than we win, but when we do win, the payoffs should more than make up for it. That’s exactly what’s happening here!
How does this stack up to our overall expectations? Let’s run another Monte Carlo simulation:
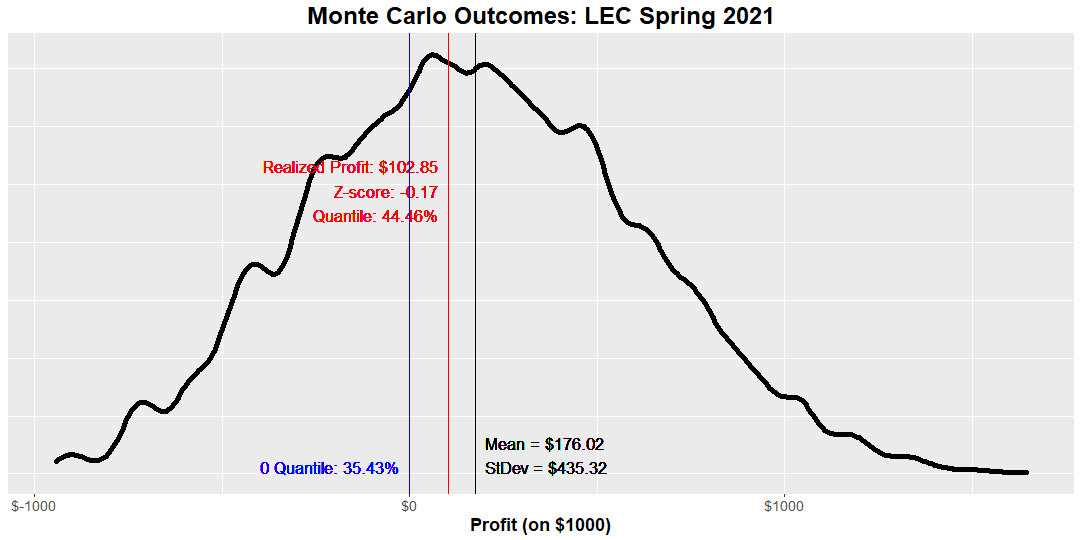
We didn’t quite hit the expectation, but given the rather high standard deviation ($435 on a mean of $176), we came quite close. Odds of being unprofitable in LEC were actually higher than in LCS (35.43% here, vs. 29.96% in LCS). Both the high standard deviation and the odds of being unprofitable are largely due to the very low number of bets placed here. If you think you’ve got some crazy blackjack strategy that you’re going to retire off of, you’re going to want to play a lot more than just 14 hands to squeeze out that edge.
Overall Performance
We’ve spent a lot of time talking about LCS and LEC because those are some of the more-watched leagues, but as I mentioned earlier, our model doesn’t really discriminate on where it can find profit. While we’ve publicly posted the LCS and LEC bets, we’ve been generating predictions for every single professional match we could find odds data on.
As we bet on more matches, not only does our profit go up, but our relative variance goes down! (actual variance increases, but variance relative to our expected profit goes down. This is closely tied to the Law of Large Numbers, a topic which we’ll go into more detail on in a future article).
From when we first started tracking odds in mid-January, through March 15th, we would have tracked 1607 professional matches and placed bets on 741 of them. The result?
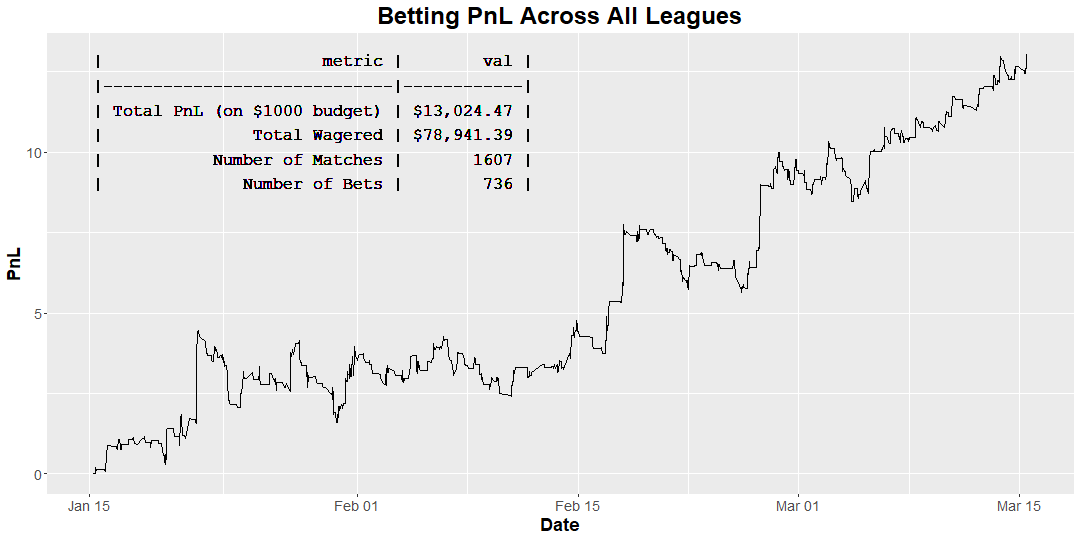
Based on our bet unit size of $1000, we’d be up over $13k! A bet unit of $1000 doesn’t quite mean that you only needed $1000 to start this, but it’s not worth worrying too much about this right now - we’ll cover the concept in more detail in a future article. At worst, even if you had to front all $79k worth of wagers up front (you don’t, by the way), this would still be a 16.5% return over two months, which isn’t too shabby (the S&P 500 is up ~5.5% over that period, and averages around 7-8% annually). What’s worth gleaning from this chart, however, is that while it still has swings up and down, it has a relatively consistent return profile over time, simply because placing so many bets smooths out the bumps in the road.
If we look at the returns of each league, we can see quite a bit of variability, as each league is, in a way, a random sampling of all of these games:
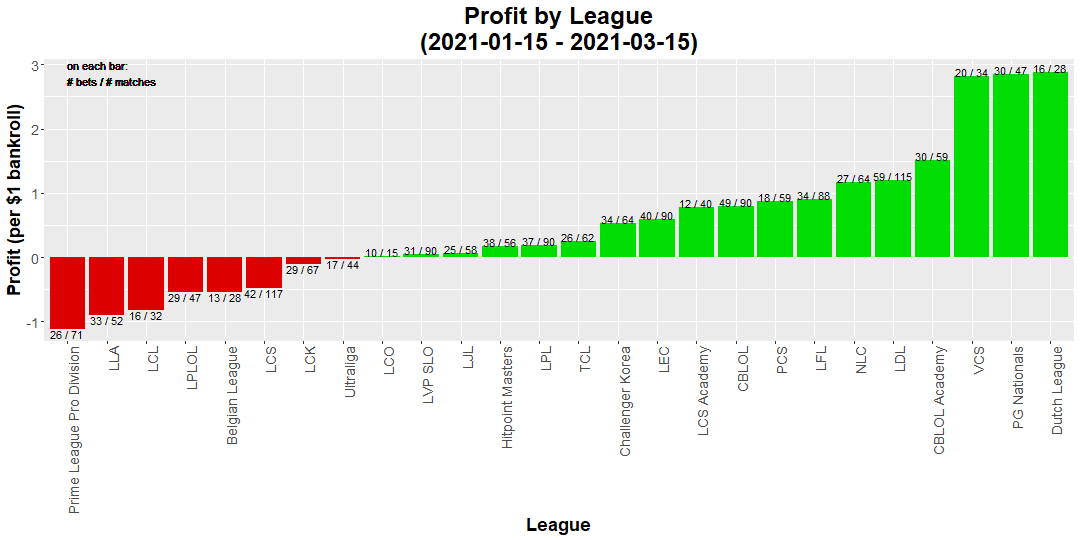
(a quick note on LCS: we’re showing 42 bets on 117 games here. This is because we’re including the lock in tournament in our total bets, whereas the above analysis looked exclusively at the spring season)
Of the 26 leagues in our data set, 18 of them were net positive for us! This actually stacks up pretty well with expectations: the two leagues we took a closer look at had simulated probabilities of 28% and 35%, respectively, of being unprofitable, so ~31% of leagues actually being unprofitable sits right in the middle of that.
Not to sound like a broken record, but this really is the single most important takeaway: no matter how good you think your model is, there’s still random chance involved. The more bets you place, the closer your results will be to your expectations. We’re working on a way to get all of these predictions into your hands, so make sure you’re subscribed here and follow us on twitter, to keep up with all of our developments and predictions and stay ahead of the game!